Amniote life histories
Where the species come from
The Amniote life-history database 1 was compiled for comparative analyses of mammals, birds and reptiles. Traits come from published studies, databases and books, with the median where sources differ. It holds 21,322 species in 36 columns; a row is one species. It is released under CC0 1.0 (data DOI 10.6084/m9.figshare.3563457.v1). The command
uv run python examples/amniote/run.py
downloads the 6.5 MB archive, checks it against examples/amniote/manifest.toml and refits every number.
The attributes
longevity (+1)         maximum longevity, years
                       column maximum_longevity_y
litter size (+1)       litter or clutch size, count
                       column litter_or_clutch_size_n
litters per year (+1)  litters or clutches per year
                       column litters_or_clutches_per_y
earliness (-1)         female age at maturity, days, inverted
                       column female_maturity_d
body mass (covariate)  adult body mass, grams
                       column adult_body_mass_g
Maturity in days is a time cost, so the metric is earliness, its inverse: a judgement the analyst states. The table writes a missing value as -999. Read as missing, the complete cases with all five attributes strictly positive are 2,770 species, 13 percent of the table: 1,548 mammals, 1,028 birds and 194 reptiles.
What the fit is asked
The fast-slow continuum sets long life against early, fecund reproduction and has been re-evaluated for mammals 2. Near the frontier, does longevity trade against earliness and fecundity, and which reproductive measure carries the fast side?
The fit
LogAffinePreconditioner takes the log of each attribute and applies a standard scaler. Three treatments of body mass are fitted: kept in the metrics, partialled out (the linear effect of log mass removed from each log-metric) and dropped, which adds six species. The contending set and the signs hold under all three, except that partialling out mass adds litters per year.
Annual fecundity, litter size times litters per year, is a function of two metrics already present. Added as a fifth metric it takes exponent 0.00 and changes no other number, so it is set aside.
For the four-metric fit at K = 1 the fit temperature is 10.7, chosen so that a tenth of species lie above the surface. The contending set is longevity, litter size and earliness. At K = 2 and the same temperature the terms hold 0.66 and 0.34 of the near-frontier species, and the mean slack falls from 0.412 to 0.345, status certified. The second term puts more weight on fecundity and less on longevity.
import sys

sys.path.insert(0, ".")
from examples.amniote import run
from tradespace import (
    HyperbolicTradeSpace,
    select_temperature,
)
from tradespace.plotting import plot_ternary

x = run.complete(run.load())
cols = [run.COLS[i] for i in (0, 3, 2)]
M = run.condition(x, cols=cols, orient=[1, -1, 1])
tau = select_temperature(M, 0.10, bounds=(3, 1e4))
fit = HyperbolicTradeSpace(temperature=tau, random_state=0).fit(M)
names = ["longevity", "earliness", "litters per year"]
plot_ternary(fit, M, names=names, lines=True)
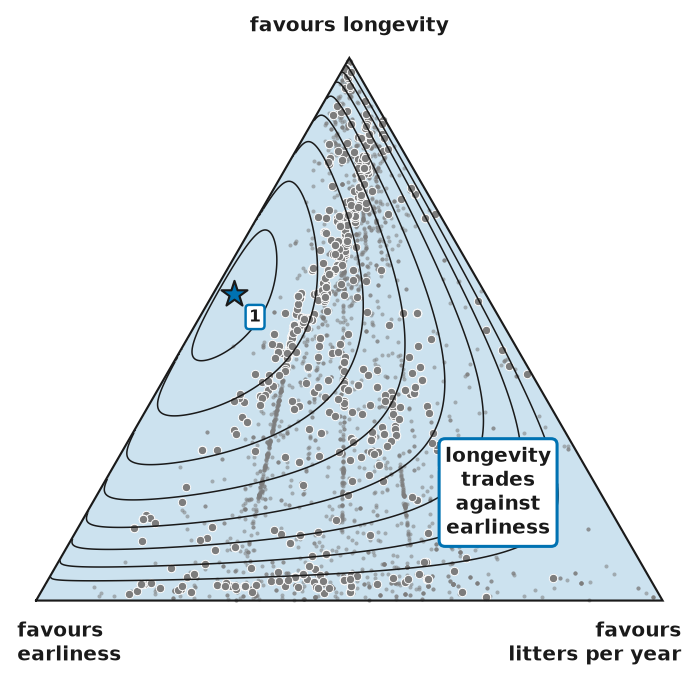
Across the standard, robust and quantile scalers and the three mass treatments, with maturity inverted, longevity and earliness are in the contending set in every row. Their near-frontier association is -0.89 to -0.97, and longevity against litters per year is -0.60 to -0.67. Longevity against litter size is -0.04 to -0.17.
The exponents move across the same rows: longevity 0.41 to 0.53, earliness 0.30 to 0.36, litter size 0.09 to 0.15, litters per year 0.00 to 0.14. With no scaler earliness takes all the exponent: the raw units decide the fit.
The orientation. Read the other way, with later maturity as better, the contending set changes from longevity, litter size and earliness to longevity and litters per year, and the association of longevity with maturity goes from -0.97 to +0.84. A quantile map does not repair a wrong direction: with maturity not inverted it gives +0.76 and the same set.
The check on your own dataset. State for each attribute whether more is better, with the reason. Flip each time or cost metric once and refit; if the contending set or a sign from trade_off_report changes, the orientation decided the result and the analysis says so.
What the fit says
Among the species nearest the frontier, a long life comes with late maturity and few litters a year: the fast-slow continuum, with earliness its strongest axis and litters per year the fecundity side. Litter size contends but is nearly unrelated to longevity. The reading rests on one judgement: maturity is a cost.
What the example cannot show
There is no designer: a point on the frontier is a species that evolved, not a design. The complete cases are the well-studied end of the table.
-
Nathan P. Myhrvold, Elita Baldridge, Benjamin Chan, Dhileep Sivam, Daniel L. Freeman, and S. K. Morgan Ernest. An amniote life-history database to perform comparative analyses with birds, mammals, and reptiles. Ecology, 96(11):3109, 2015. doi:10.1890/15-0846R.1. ↩
-
Jon Bielby, Georgina M. Mace, Olaf R. P. Bininda-Emonds, Marcel Cardillo, John L. Gittleman, Kate E. Jones, C. David L. Orme, and Andy Purvis. The fast-slow continuum in mammalian life history: an empirical reevaluation. The American Naturalist, 169(6):748–757, 2007. doi:10.1086/516847. ↩