tradespace
For an analyst with a table of evaluated designs. The paper makes the argument for the method; the project page links it, these docs and the package.
- Use it on my own table: install and run a first fit.
- Bring my own system model, and know what must hold
- Place it beside principal component analysis, or PCA, and scikit-learn
- Read the limits
- See the worked case: a cubesat trade study, a synthetic satellite demonstrator.
- Pick a point on the chart and get a design: the route back, the conjecture it is and how to check it.
tradespace learns the shape of a design trade space from evaluated designs. Give it a
table of designs, each scored on several metrics where larger is better, and it fits a frontier
model in the posynomial invariant form: a sum of terms, where a term (a product of
powers of the metrics) is one trade-off. It then tells you which metrics contend, with what
elasticity, where each design sits relative to the fitted reference surface, and where the table has white space.
A first fit, on a synthetic table of 300 designs scored on 3 metrics:
from tradespace import (
    HyperbolicTradeSpace,
    make_frontier_data,
    trade_off_report,
)
from tradespace.plotting import plot_log_plane

X, info = make_frontier_data(300, 3, random_state=0)
ts = HyperbolicTradeSpace(temperature=20.0).fit(X)
report = trade_off_report(ts, X)
print(report.lemma_name, report.contending_set)
print(report.exponents.round(2))
X2 = X[:, :2]
ts2 = HyperbolicTradeSpace(temperature=20.0).fit(X2)
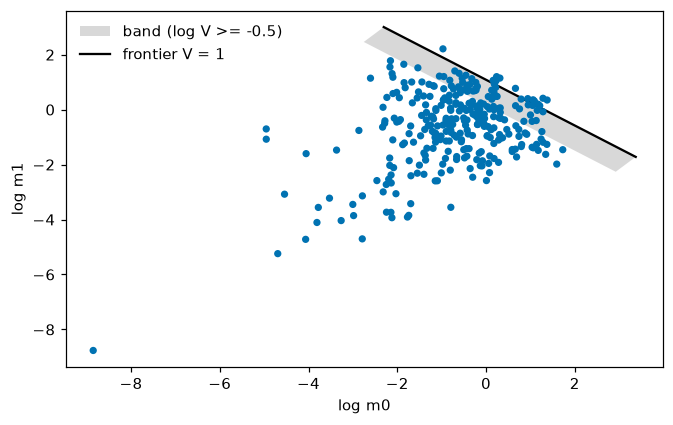
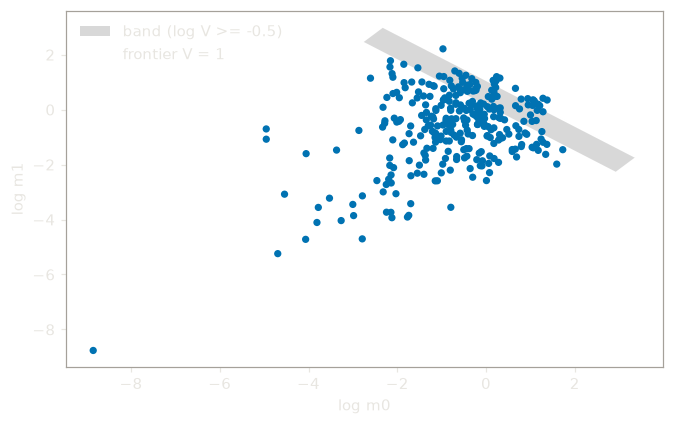
plot_log_plane(ts2, X2, band=0.5)
It is a scikit-learn estimator (fit, transform, inverse_transform, score_samples) in
unsupervised learning, beside PCA: PCA finds where the data spread, this finds where they stop, and
the two chain.