Broadbalk wheat: grain against straw
Where the plot-years come from
Broadbalk, at Rothamsted, has grown winter wheat since autumn 1843 to test mineral fertilizers and manure on strips, in sections later given different rotations. The Electronic Rothamsted Archive publishes its grain and straw yields for 1968 to 2022 as doi:10.23637/rbk1-yld6822-01 (Glendining and Poulton, 2023) under CC BY 4.0. A row is one plot in one year. Fetch the download by hand and rebuild the derived table with uv run python examples/wheat/derive.py examples/wheat/data/01-YLD6822.zip.
The attributes
grain (+1)      grain yield, t/ha at 85% dry matter; column grain
straw (+1)      straw yield, t/ha at 85% dry matter; column straw
configuration   treatment (fertilizer_code), cultivar,
                year (harvest_year)
also kept       plot, nitrogen in kg/ha (total_fertilizer_n_amount),
                cropping, section
The committed derived table, examples/wheat/derived/grain_straw.csv, is what the code reads: 3,753 plot-years with both yields recorded and positive, 44 percent of the archive's 8,573.
What the fit is asked
Old and modern wheat cultivars reach similar biomass, and the modern ones put more of it in grain: a higher harvest index, grain over grain plus straw (12). Near the frontier of Broadbalk's yields, does grain trade against straw, and does the harvest index differ between the cultivars of 1968 and of 2022?
The fit
Each yield is taken in logs and given a standard scaler, orientation +1, shift 0 (conditioning).
The temperature is the one that puts a tenth of the rows above the frontier: 8.3, a band of 0.12 in log V. At one term grain's exponent is 0.45 and straw's 0.55, the contending set is both, and the association of the two log yields near the frontier is -0.87.
import pandas as pd
from tradespace import (
    HyperbolicTradeSpace,
    LogAffinePreconditioner,
    select_temperature,
)
from tradespace.plotting import plot_log_plane

path = "examples/wheat/derived/grain_straw.csv"
raw = pd.read_csv(path)[["grain", "straw"]].to_numpy()
pre = LogAffinePreconditioner(
    orientation=1, shift=0.0, scaler="standard"
)
M = pre.fit_transform(raw)
tau = select_temperature(M, target_frac_above=0.1, bounds=(3.0, 1e4))
fit = HyperbolicTradeSpace(temperature=tau, random_state=0).fit(M)
ax = plot_log_plane(fit, M, levels=(0.1, 0.25, 0.5, 1.0, 1.5))
ax.set_xlabel("log grain, standardized")
ax.set_ylabel("log straw, standardized")
print(round(tau, 1), fit.exponents_.round(2))
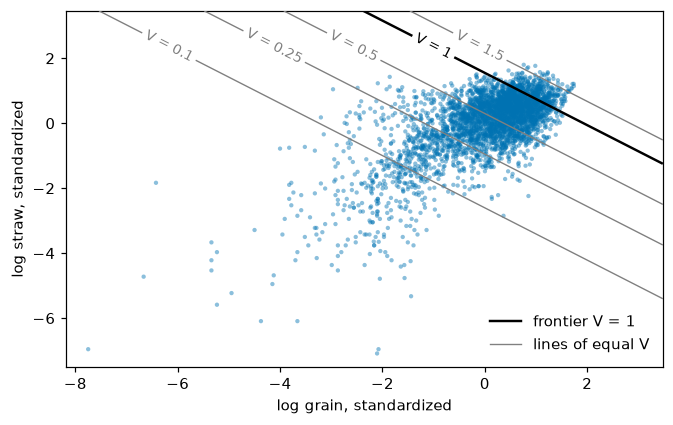
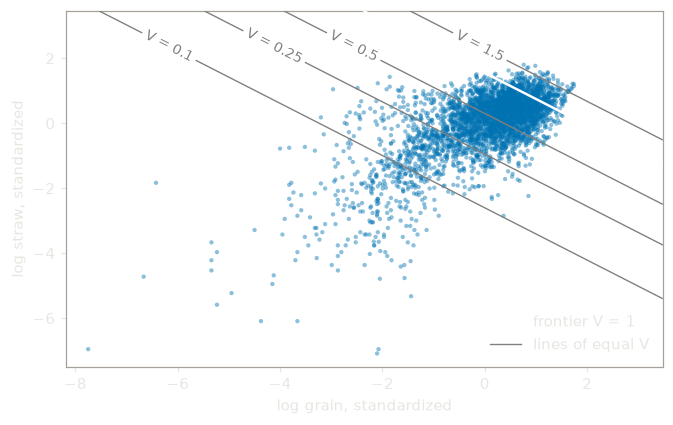
At two terms, at the same temperature, the terms carry shares of 0.57 and 0.43 of the near-frontier rows and the fit is certified. The mean level below the frontier falls from 0.859 to 0.748. The second term has grain alone as its contending set, a limit on grain with straw free, which one term cannot show; it holds in 7 of the 15 rows of the conditioning ladder, so it is read as conditional.
The ladder. Grain's exponent runs from 0.29, with no scaler, to 0.72, in Section 1 and in modern cultivars at nitrogen of at least 96. That subset takes straw's weight from 0.55 to 0.28. A negative association, -0.62 to -0.90, holds in every row of the scaler, cap, subset and trend variants.
Functions of the two yields. Biomass, a function of grain and straw, takes exponent 0.00 and leaves the fit unchanged. The fitted level V, a weighted geometric mean of the two yields, is an index of biomass: across the plot-years log V correlates with log biomass at 0.99. The harvest index displaces grain, whose exponent falls to 0.00, and the second term goes. Rotating the two log yields before the fit and pulling the frontier back weights grain and straw by 0.71 and -0.23, or -0.11 and 0.71 with the second component reversed: a frontier that rewards less of one yield, with no ceiling.
The cultivars. At nitrogen of at least 96 kg per hectare the median harvest index is 0.52 for Cappelle Desprez (1968 to 1978) and 0.76 for Zyatt (2019 to 2022), at median total biomass of 8.97 and 8.75 t per hectare.
The check on your own dataset. Refit with one conditioning change at a time, the scaler, a cap, a subset or a removed trend, and read the contending set, the sign of the association, each exponent's range and the second term's set. A weight that moves with the scaler is the scaler's.
What the fit says
At a fixed level grain trades against straw at the rate the exponents give. Near the frontier a plot-year with more grain has less straw, in every variant. The newest cultivar puts three quarters of its biomass in grain, the oldest half, at much the same total: the shift the breeding studies report. The ceiling on grain alone is conditional.
What the example cannot show
The table is the straw-recorded subset, not the experiment. Cultivar is confounded with decade and weather, so the cultivar comparison describes and does not test breeding.
-
R. B. Austin, J. Bingham, R. D. Blackwell, L. T. Evans, M. A. Ford, C. L. Morgan, and M. Taylor. Genetic improvements in winter wheat yields since 1900 and associated physiological changes. The Journal of Agricultural Science, 94(3):675–689, 1980. doi:10.1017/S0021859600028665. ↩
-
R. B. Austin, M. A. Ford, C. L. Morgan, and D. Yeoman. Old and modern wheat cultivars compared on the broadbalk wheat experiment. European Journal of Agronomy, 2(2):141–147, 1993. doi:10.1016/S1161-0301(14)80144-5. ↩